Best Stock to Buy Right Now: Nike vs. Starbucks
When you think about iconic American brands, Nike (NYSE: NKE) and Starbucks (NASDAQ: SBUX) are likely to come to the top of your mind. Both companies have a long history of delivering outsized returns for shareholders, but 2024 has been a different story, with each stock down more than 20% year to date.
Anytime a blue chip stock is down considerably, it's worth revisiting to determine whether it's a minor blip or a more significant downtrend. So, with that in mind, let's look at Nike and Starbucks' recent financial results, balance sheets, dividends, and valuations to find out which stock is the better buy right now.
The top and bottom lines
As a shareholder of a company, you are investing in future growth, and generally speaking, anytime a company's revenue and net income decrease or fall below expectations, the market will punish the stock. Look no further than Nike and Starbucks, which have both dropped roughly 15% since reporting their most recent quarterly earnings.
For Nike's fiscal fourth quarter of 2024 ended May 31, the company reported $12.6 billion in net sales, marking a 2% year-over-year decline. Management attributed this drop to a downturn in its lifestyle business, a 10% decrease in digital sales, and weakened demand in China. CFO Matthew Friend cautioned during the earnings call that this decline might not be a temporary setback, warning that "the next few quarters will be challenging."
Similar to Nike, Starbucks also faced slowing demand. Specifically, the beverage giant saw comparable sales fall 3% with 7% fewer transactions in fiscal Q2 2024 ended Mar. 31 compared to its fiscal Q2 2023. Overall, Starbucks generated $8.56 billion in net sales, resulting in a year-over-year decline of 1.8%. The drop in revenue and earnings is even more discouraging amid the backdrop of higher-than-average inflation and Starbucks opening 583 net-new stores during that time. Starbucks management also blamed a decline in store traffic and weak demand in China for the disappointing quarter. Looking ahead, Starbucks management has revised its revenue-growth guidance for fiscal 2024 from the previous range of 7% to 10% down to "low single digits." Similarly, its earnings-per-share growth forecast has been adjusted from 15% to 20% to "flat to low single digits."
Looking at each company's bottom line, it's clear that Nike generated $1.5 billion in net income for its most recently reported quarter, representing 45% year-over-year growth in part due to its ability to expand its gross margin by 1.1%. For comparison, Starbucks generated $772 million in net income during its fiscal Q2 2024, equating to a 15% year-over-year decline.
Despite selling completely different consumer products, Nike and Starbucks face similar challenges. Still, this category goes to Nike, considering it grew its gross margin and net income despite its slowing sales.
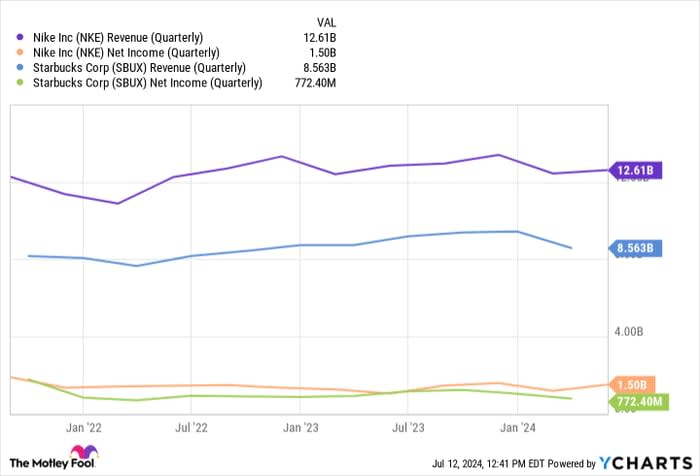
NKE Revenue (Quarterly) data by YCharts.
Nike and Starbucks prioritize dividends
For mature companies like Nike and Starbucks, shareholders expect to see capital returned to them by management in the form of dividends and share repurchases.
Nike currently pays a quarterly dividend of $0.37 per share, equating to an annual yield of 2%. Notably, Nike has paid and raised its dividend for 23 consecutive years, demonstrating that returning capital to shareholders is a priority for management.
Comparably, Starbucks consistently pays and increases its dividend, with 13 consecutive years of dividend growth. Starbucks does pay a higher quarterly dividend at $0.57 per share, representing an annual yield of 3.1%.
Given the recent drop in each stock, its dividend yields are near an all-time high. But for any dividend-paying stock, it's important to examine its payout ratio, which measures the percentage of earnings it pays out to investors through dividends. Generally, a stock with a payout ratio of 75% or higher is when investors should worry that the company could potentially pause dividend increases or cut them altogether. Nike has a significantly lower payout ratio at 28.2% compared to Starbucks' 60.3%. That means investors can reasonably expect dividend increases in the near future.
Both companies have relatively pedestrian share-repurchase programs, with each having lowered its shares outstanding by less than 1% over the past three years. Nonetheless, both companies ensure that their shares aren't diluted and that shareholders' ownership stakes are growing, albeit slowly.
The decision is a close call due to Nike's lower payout ratio and longer dividend-growth history, but let's give this category to Starbucks for the higher-annual yield.
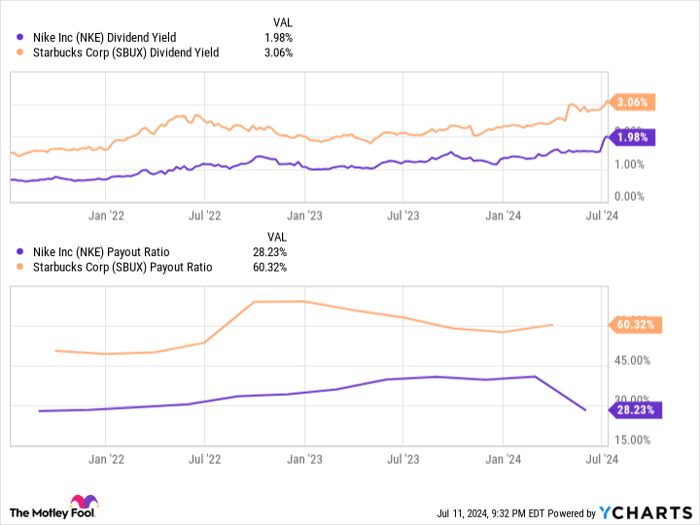
NKE Dividend Yield data by YCharts.
The financial health of each company
A company's balance sheet serves as a vital snapshot of its financial health. Notably, Nike boasts a superior cash position with $2.7 billion in net cash, starkly contrasting to Starbucks' $13.1 billion net debt. Impressively, Nike's net-cash position has surged by 498% year over year, while Starbucks' net debt has deteriorated by approximately 8%.
As a result, over the trailing 12 months, Nike earned $161 million in interest income compared to Starbucks, losing $446 million in interest expenses. At a time when interest rates are relatively high, Starbucks will likely see growing interest expenses in the years ahead, while Nike can earn extra income with its cash pile.
With Nike's cash pile, the shoe and apparel behemoth wins this category in a landslide.
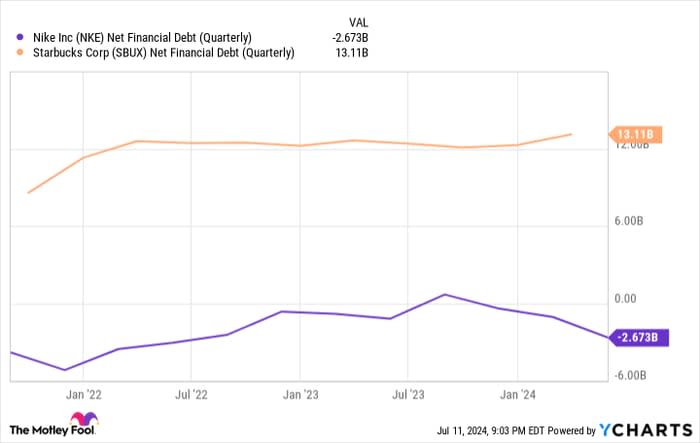
NKE Net Financial Debt (Quarterly) data by YCharts.
Is Nike or Starbucks the better buy?
Given Nike and Starbucks' long, proven track records, the companies deserve some patience no matter how frustrating the recent financial and stock performance has been. This sentiment is especially true when considering both stocks are trading at or near a three-year low forward price-to-earnings ratio, which measures a company's current stock price to its expected earnings per share over the next 12 months, indicating both stocks are trading at cheap valuations. Specifically, Nike trades 23.1 times forward earnings, and Starbucks trades 20.8 times forward earnings. Still, if you have to pick between the two stocks, Nike is the clear winner due to its stronger cash position and stable earnings.
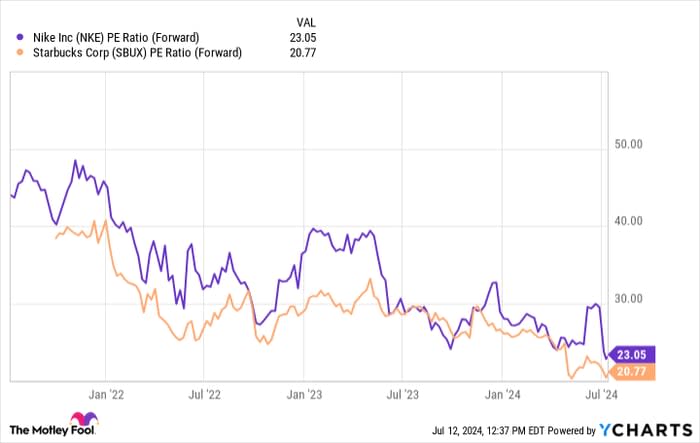
NKE PE Ratio (Forward) data by YCharts.
Should you invest $1,000 in Nike right now?
Before you buy stock in Nike, consider this:
The Motley Fool Stock Advisor analyst team just identified what they believe are the 10 best stocks for investors to buy now… and Nike wasn’t one of them. The 10 stocks that made the cut could produce monster returns in the coming years.
Consider when Nvidia made this list on April 15, 2005... if you invested $1,000 at the time of our recommendation, you’d have $791,929!*
Stock Advisor provides investors with an easy-to-follow blueprint for success, including guidance on building a portfolio, regular updates from analysts, and two new stock picks each month. The Stock Advisor service has more than quadrupled the return of S&P 500 since 2002*.
*Stock Advisor returns as of July 8, 2024
Collin Brantmeyer has positions in Nike. The Motley Fool has positions in and recommends Nike and Starbucks. The Motley Fool recommends the following options: long January 2025 $47.50 calls on Nike. The Motley Fool has a disclosure policy.
