Nvidia Sell-Off: Is It Time to Be Concerned?
I'm a longtime Nvidia (NASDAQ: NVDA) bull. But even I'm concerned about what's happening with Nvidia stock right now.
Consider this: Nvidia's stock has experienced its first 20% drawdown since the start of 2023.
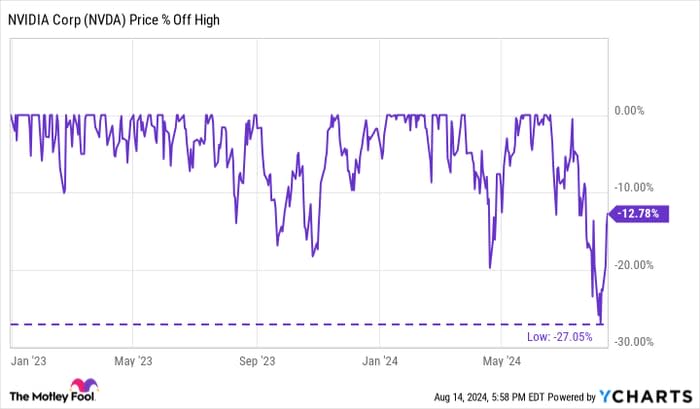
In other words, the market finally found a gap in Nvidia's armor. Sure, Nvidia has already bounced off its lows and could recover and make new highs, but is it time to worry that Nvidia's flawless longer-term bull run is coming to an end? Let's dive in and see.

Image source: Getty Images.
What's happening with Nvidia?
Since reaching an all-time high of $140.76 in June, Nvidia shares fell by 27%. That may not seem like all that much. Yet, bear in mind, at its peak, Nvidia boasted a market cap of more than $3.2 trillion -- making it briefly the world's largest public company.
During its drawdown, it shed more than $650 billion in value -- roughly equivalent to the total market cap of Tesla, America's 10th-largest company.
In other words, Nvidia's recent sell-off is a big deal. And not just because of the value it has lost -- after all, that could be recovered in a similarly short amount of time. No, the bigger concerns are why Nvidia dropped so steeply and whether it could have been the result of fundamental weakness for the company and its stock.
Let's see what the numbers say.
Tale of the tape: How does Nvidia measure up?
It's true: Nvidia's stock has skyrocketed over the last few years. So, let's boil down what's behind that success. In my opinion, it comes down to two key factors:
Rising sales
Rising expectations of future sales
To put it another way, Nvidia's stock has skyrocketed because its revenue is way up, and expectations of its future revenue keep increasing, too. So, can that continue?
If you look at Nvidia's revenue over the past two years, it's easy to see why its stock has exploded higher. The company has roughly tripled its revenue from $25 billion/year to over $75 billion/year on the back of massive graphics processing unit (GPU) sales -- the "brains" behind artificial intelligence (AI).
But that's not the only reason for the stock's success. Along with this massive revenue growth, investors have been willing to pay far more for each dollar in revenue based on increased expectations of future revenue growth. That's why Nvidia's price-to-sales (P/S) ratio has also risen. In 2022, it bottomed under 10 times. However, just a few weeks ago, Nvidia's P/S ratio was an astonishing 42 times.
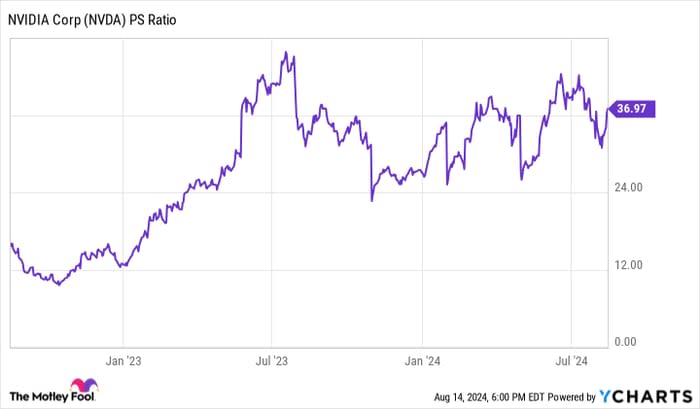
NVDA PS Ratio data by YCharts
The only way to explain this change is that investors expect Nvidia's sales to grow -- rapidly. Indeed, analysts expect Nvidia to double its sales to nearly $120 billion this year. However, this is where concerns begin to bubble up.
What if those same analysts temper their expectations for Nvidia's revenue growth or, even worse, begin to lower those sales estimates? That would call into question the massive valuation premium investors have been paying (as represented by Nvidia's P/S ratio) and, in turn, result in another significant sell-off in the stock.
For some answers about whether this is possible, let's examine this chart, which shows how Wall Street analysts have adjusted their revenue estimates over the last three years.
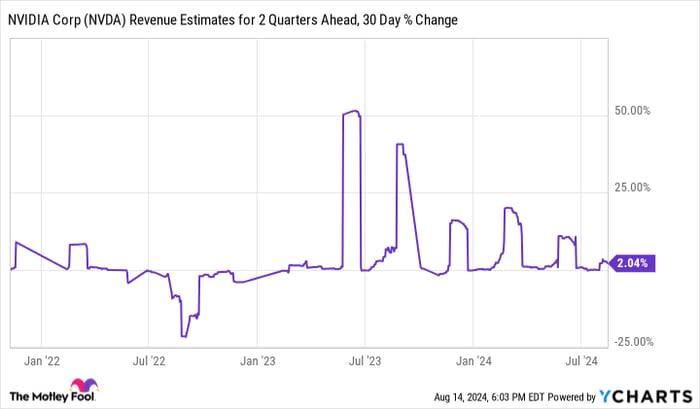
NVDA Revenue Estimates for 2 Quarters Ahead, 30 Day % Change data by YCharts
This chart shows how much analysts have adjusted their estimates of Nvidia's future revenue (two quarters away) over the last 30 days. Peaks represent large increases (good for the stock); valleys represent decreases (bad for the stock).
As you can see, there have been far more peaks than valleys over the last two years. However, those peaks have been decreasing in size. That means that with each quarterly report, analysts have been closer to matching Nvidia's sales guidance. In other words, Wall Street's expectations are starting to catch up to reality. If that trend holds, those factors should reach equilibrium, then perhaps reverse -- company guidance may fall below expectations, and analysts will have to cut their revenue forecasts, resulting in valleys on this chart and a falling share price for Nvidia.
What's the takeaway for investors?
To sum it up, Nvidia's stock has been on a rocket ride for almost two years. Similarly, its sales and sales expectations have taken off, too. Yet, those high expectations have also driven up its stock valuation. In turn, the stock is highly vulnerable to a sharp downturn. Investors should be cautious with Nvidia stock. Even though the company remains well positioned for the long term, volatility in the short term means the stock is not a good match for some investment portfolios right now.
Should you invest $1,000 in Nvidia right now?
Before you buy stock in Nvidia, consider this:
The Motley Fool Stock Advisor analyst team just identified what they believe are the 10 best stocks for investors to buy now… and Nvidia wasn’t one of them. The 10 stocks that made the cut could produce monster returns in the coming years.
Consider when Nvidia made this list on April 15, 2005... if you invested $1,000 at the time of our recommendation, you’d have $752,835!*
Stock Advisor provides investors with an easy-to-follow blueprint for success, including guidance on building a portfolio, regular updates from analysts, and two new stock picks each month. The Stock Advisor service has more than quadrupled the return of S&P 500 since 2002*.
*Stock Advisor returns as of August 12, 2024
Jake Lerch has positions in Nvidia and Tesla. The Motley Fool has positions in and recommends Nvidia and Tesla. The Motley Fool has a disclosure policy.
