States Where the Rich Get Richer and the Poor Get Poorer

The debate over the wealth gap and whether the rich are advancing at a faster rate than the poor has been a political football for years. In times like these, hard data can be a good indicator of exactly how the rich and poor are faring in America.
To get some insight into the matter, GOBankingRates culled income data from the American Community Survey for 2019, 2018 and 2014 to determine where the rich are getting richer and the poor are getting poorer. The percentage change in the incomes of the top 5% and the bottom 20% of Americans was compared over one- and five-year ranges to rank individual states.
Wages: Being Rich vs. Being Wealthy: Learn Which One Can Land You in the Poor House
The Richest of the Rich: Just How Rich Are Elon Musk, Donald Trump and These Other Big Names?
Overall, the data came in as might be expected, although some comparisons were stark. The bottom 20% income earners in Louisiana and two other states, for example, actually showed a decrease in average income over a one-year period, while the top 5% in many states grew their incomes by double digits. When placed side by side, the data show tremendous gains for the rich in numerous states, while the poorest Americans have struggled to keep up in terms of wage gains.
Here's a look at the top states where the rich got richer and where the poor got poorer over the prior one- and five-year periods. The data is divided into two sections: The first section lists the top 15 states in terms of wage gains for the top 5%, while the second section shows the states where the bottom 20% exhibited the slowest wage growth. See which list your state is on, and learn the difference between being rich and being wealthy.
Last updated: June 17, 2021

Top 15 States Where the Rich Are Getting Richer
"The rich get richer" is not just a catchphrase in America. It's a reality, as demonstrated by the American Community Survey data. In Nevada, those in the top 5% of incomes saw their earnings jump a whopping 21.76%, or more than $74,000, in a single year. This placed Nevada at the top of the list in terms of average one-year income jump. Proving this wasn't a fluke, Nevada also took the five-year percentage change crown, with those in the top 5% seeing their incomes rise by an astronomical 41.58%.
Nevada's top 5 percent earners were far from alone in amassing those gains, however, as all of the states in the top 15 saw five-year percentage gains of at least 27%. In fact, 11 states saw percentage gains of at least 30%, with Washington nipping at Nevada's heels with a 40.1% jump in average income. In pure dollar terms, incomes over the past five years for the top 5% grew by as much as $138,480, in the case of California. States are ordered in terms of combined wage growth over the prior one- and five-year periods.
Sponsored: Have you checked your Credit Score recently? Your Credit Score can be an indication to a lender whether you are creditworthy or not. Higher scores may mean more favorable approval odds, competitive interest rates or better credit card deals. Check your Score for Free today and get your TransUnion Credit Report for $1.

15. Idaho
2019 top 5% average income: $325,365
2014 top 5% average income: $249,679
5-year net change in average income: $75,686
5-year percentage increase in average income: 30.31%
Learn More: How Long $1 Million in Savings Will Last in Every State
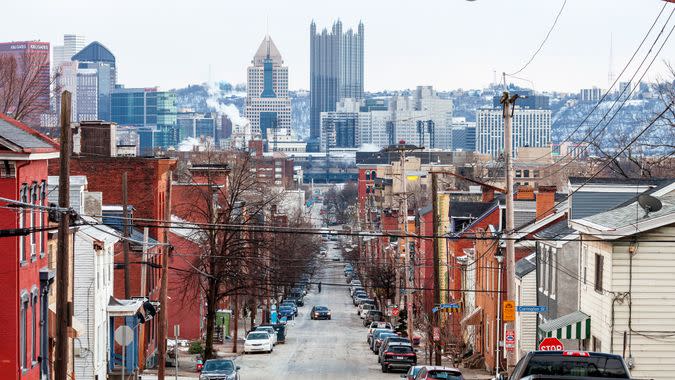
14. Pennsylvania
2019 top 5% average income: $403,160
2014 top 5% average income: $314,208
5-year net change in average income: $88,952
5-year percentage increase in average income: 28.31%
Important: Almost Every State Is In Debt Thanks to COVID-19 — What Now?

13. Oklahoma
2019 top 5% average income: $352,070
2014 top 5% average income: $275,201
5-year net change in average income: $76,869
5-year percentage increase in average income: 27.93%
Time To Move? The Richest Small Town in Every State

12. New York
2019 top 5% average income: $553,773
2014 top 5% average income: $428,257
5-year net change in average income: $125,516
5-year percentage increase in average income: 29.31%

11. Mississippi
2019 top 5% average income: $304,820
2014 top 5% average income: $239,195
5-year net change in average income: $65,625
5-year percentage increase in average income: 27.44%
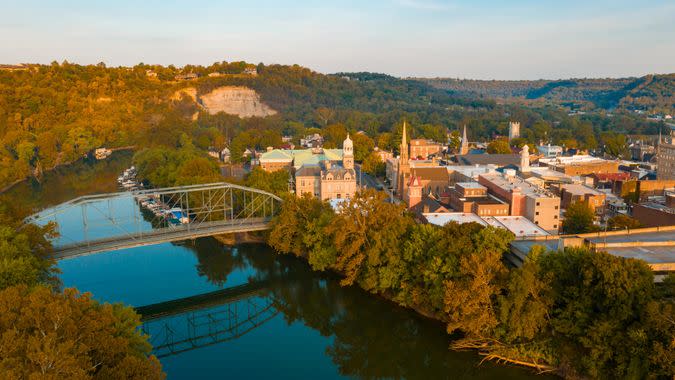
10. Kentucky
2019 top 5% average income: $333,777
2014 top 5% average income: $255,295
5-year net change in average income: $78,482
5-year percentage increase in average income: 30.74%
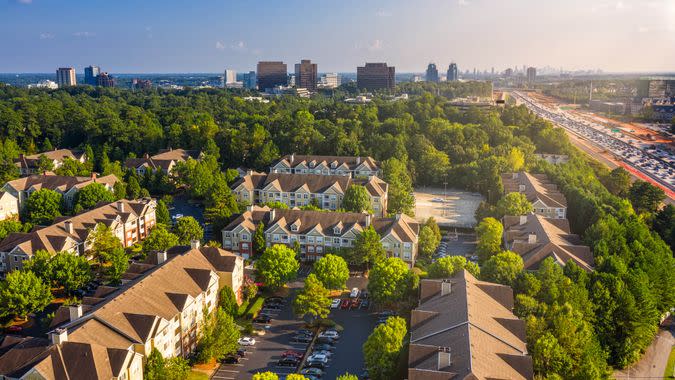
9. Georgia
2019 top 5% average income: $402,002
2014 top 5% average income: $304,170
5-year net change in average income: $97,832
5-year percentage increase in average income: 32.16%

8. Colorado
2019 top 5% average income: $450,609
2014 top 5% average income: $342,265
5-year net change in average income: $108,344
5-year percentage increase in average income: 31.66%

7. Indiana
2019 top 5% average income: $348,590
2014 top 5% average income: $262,537
5-year net change in average income: $86,053
5-year percentage increase in average income: 32.78%
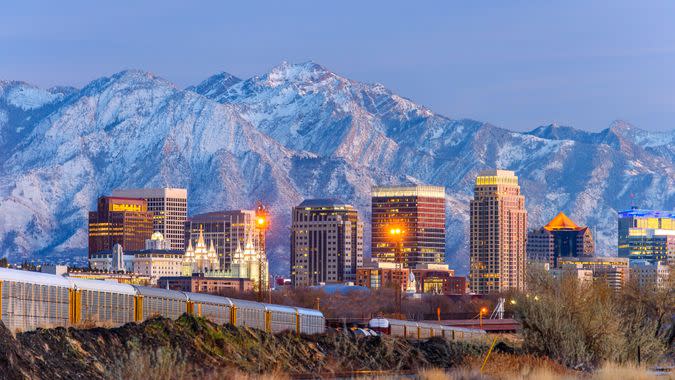
6. Utah
2019 top 5% average income: $403,396
2014 top 5% average income: $300,894
5-year net change in average income: $102,502
5-year percentage increase in average income: 34.07%

5. California
2019 top 5% average income: $531,014
2014 top 5% average income: $392,534
5-year net change in average income: $138,480
5-year percentage increase in average income: 35.28%
Learn More: Surprising Ways Gen Z and Millennials Are Worlds Apart Financially

4. Montana
2019 top 5% average income: $350,655
2014 top 5% average income: $258,739
5-year net change in average income: $91,916
5-year percentage increase in average income: 35.52%

3. South Carolina
2019 top 5% average income: $355,363
2014 top 5% average income: $261,150
5-year net change in average income: $94,213
5-year percentage increase in average income: 36.08%
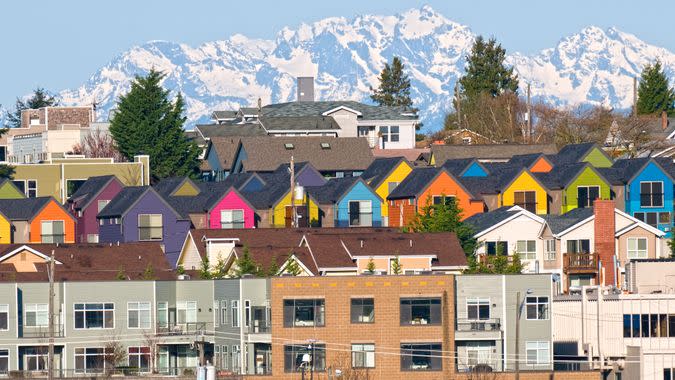
2. Washington
2019 top 5% average income: $457,171
2014 top 5% average income: $326,321
5-year net change in average income: $130,850
5-year percentage increase in average income: 40.1%

1. Nevada
2019 top 5% average income: $415,695
2014 top 5% average income: $293,620
5-year net change in average income: $122,075
5-year percentage increase in average income: 41.58%

15 States Where the ‘Poor’ Are Getting Poorer
The data indicate that even if you live in a state where the top 5% are thriving, you still might be struggling if you're in the bottom 20% in terms of income. Some of the very same states showing tremendous growth for the top 5% also appear on the list of the slowest wage growth for the bottom 20%.
Nevada, for example, tops all states with a 21.76% one-year growth in income for the top 5%. However, if you're in the bottom income quintile in Nevada, you saw your income grow just 4.42% on average. Louisiana, Alaska and Connecticut actually showed a decrease in one-year income for the bottom 20%. This shows that in many states, the gap between rich and poor is growing by leaps and bounds.
As with the rankings for the top 5%, states in this section are ordered in terms of combined wage growth over the prior one- and five-year periods.
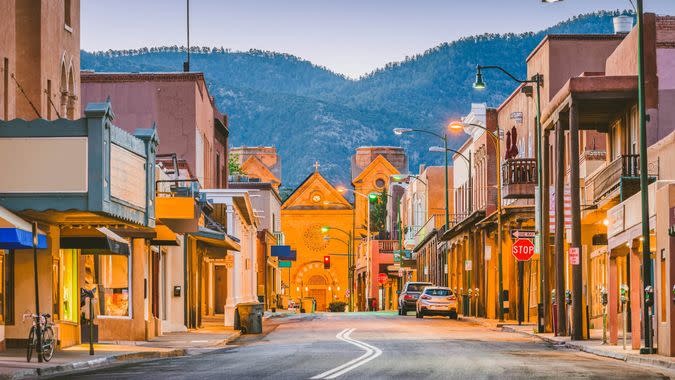
15. New Mexico
2019 bottom 20% average income: $10,976
2014 bottom 20% average income: $9,628
5-year net change in average income: $1,348
5-year percentage increase in average income: 14%

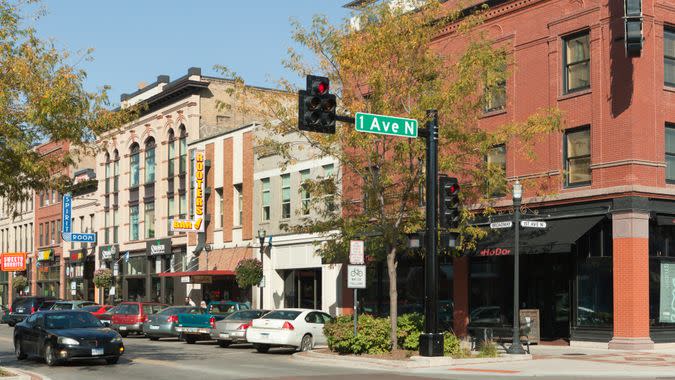
14. New York
2019 bottom 20% average income: $13,372
2014 bottom 20% average income: $11,690
5-year net change in average income: $1,682
5-year percentage increase in average income: 14.39%

13. Mississippi
2019 bottom 20% average income: $9,715
2014 bottom 20% average income: $8,527
5-year net change in average income: $1,188
5-year percentage increase in average income: 13.93%
Exclusive: Americans’ Savings Drop to Lowest Point in Years
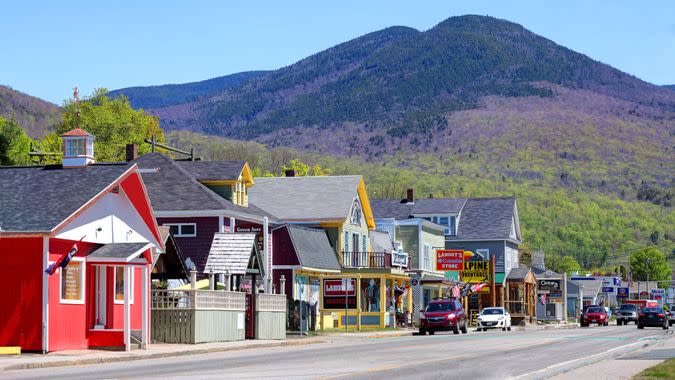
12. New Hampshire
2019 bottom 20% average income: $19,002
2014 bottom 20% average income: $16,393
5-year net change in average income: $2,609
5-year percentage increase in average income: 15.92%
11. North Dakota
2019 bottom 20% average income: $15,064
2014 bottom 20% average income: $13,080
5-year net change in average income: $1,984
5-year percentage increase in average income: 15.17%
10. Oklahoma
2019 bottom 20% average income: $12,507
2014 bottom 20% average income: $10,912
5-year net change in average income: $1,595
5-year percentage increase in average income: 14.62%
9. Vermont
2019 bottom 20% average income: $15,054
2014 bottom 20% average income: $13,265
5-year net change in average income: $1,789
5-year percentage increase in average income: 13.49%

8. Nevada
2019 bottom 20% average income: $14,425
2014 bottom 20% average income: $12,757
5-year net change in average income: $1,668
5-year percentage increase in average income: 13.08%

7. Maryland
2019 bottom 20% average income: $18,902
2014 bottom 20% average income: $16,714
5-year net change in average income: $2,188
5-year percentage increase in average income: 13.09%

6. West Virginia
2019 bottom 20% average income: $10,649
2014 bottom 20% average income: $9,509
5-year net change in average income: $1,140
5-year percentage increase in average income: 11.99%
Whoa: 9 Successful Money-Making ‘Schemes’ That Are Actually Legal
5. Delaware
2019 bottom 20% average income: $15,945
2014 bottom 20% average income: $14,361
5-year net change in average income: $1,584
5-year percentage increase in average income: 11.03%
4. Connecticut
2019 bottom 20% average income: $16,037
2014 bottom 20% average income: $14,697
5-year net change in average income: $1,340
5-year percentage increase in average income: 9.12%

3. Wyoming
2019 bottom 20% average income: $15,528
2014 bottom 20% average income: $14,739
5-year net change in average income: $789
5-year percentage increase in average income: 5.35%
2. Alaska
2019 bottom 20% average income: $18,408
2014 bottom 20% average income: $18,127
5-year net change in average income: $281
5-year percentage increase in average income: 1.55%

1. Louisiana
2019 bottom 20% average income: $9,426
2014 bottom 20% average income: $9,322
5-year net change in average income: $104
5-year percentage increase in average income: 1.12%
More From GOBankingRates
This article originally appeared on GOBankingRates.com: States Where the Rich Get Richer and the Poor Get Poorer


